We are excited to introduce the Road Map Project’s new data blog series, Data for Action. This series offers topical briefs that are responsive to community concerns and emerging advocacy priorities. Data for Action will pair data with stories to shed light on the experiences behind the numbers. Future blog posts will be co-authored by students, parents, practitioners, and program staff, covering a range of topics across the educational continuum. The CCER Data and Research Team is authoring this first edition to share about the functions they serve and the principles that guide their work, as well as to announce the release of updated indicator results in the Data Dashboard.
Overview of the CCER Data and Research Team
The CCER Data and Research Team provides reporting on system and student measures that highlight opportunities for education system improvements, support continuous improvement initiatives, and track collective progress toward Road Map Project goals. We also conduct research to understand the causes of problems in the education system, the impact that these problems have on students, and ways that we can be accountable to students—especially students of color—to fix these problems.
Over the past two years, the CCER Data and Research Team has developed a set of guiding principles as we shift toward working in true partnership with the Road Map Project community. We must actively disrupt white-dominant norms and power dynamics across data and research strategies, resources, relationships, analyses, data stewardship, and impact. Our approaches and analyses must center communities, improve data access and expose systemic barriers where action is needed, and be connected to a regional impact approach that identifies actions each person can take based upon their role(s) within the education system.
With these principles in mind, we will work more closely with youth and families to center their voices and make data more accessible. Last year, the Data and Research Team integrated under the Community and Family Engagement Team to more closely collaborate on the work across our program areas, and develop space for deeper cross-community conversations on emerging topics. Our Data and Research Team also works closely with a subgroup of parents from the Parent Leadership Team as part of a Parent Leadership Design Team that meets twice a month to prepare supporting materials for Parent Leadership Team strategic planning retreats. This collaboration is fostering deeper relationships and opportunities for mutual learning and co-creation, and getting us closer to our efforts to center families and make data more approachable.
New on the Dashboard this year
COVID-19 related changes in 2020
In early March, King County schools shifted to remote learning as the COVID-19 pandemic swept the country. As schools adapted, so did the way they measured and recorded student data. We have made several changes to our dashboard measures to better tell the story of this unprecedented school year.
- Attendance: When schools closed in March 2020, they stopped measuring daily attendance in the same way. Since strategies varied across districts, we are unable to present attendance for that part of the year in the usual way. We have added the measure “Covid-Adjusted Attendance,” which captures attendance from Sept. 1, 2019 – March 1, 2020. Using this measure, you can view attendance prior to the beginning of remote learning that began in March 2020, and view this time period consistently across years and districts.
- Discipline: Similar to attendance, we have created “Covid-Adjusted Discipline” to show exclusionary discipline from Sept. 1, 2019 – March 1, 2020.
- Assessments: Due to the pandemic, standardized assessments normally administered in the spring (such as the SBAC) were not given in 2020. No data will appear for this year.
Grading responses for graduating seniors
Twelfth-grade students were uniquely impacted by the pandemic, as they were expected to graduate despite the academic, financial, social, and health barriers caused or worsened by COVID-19. In response, Washington State issued an emergency waiver system. Schools were allowed to waive a graduation requirement or two for students who were on the brink of graduating. Some districts used this system while others gave automatic A’s, used previous semesters’ grades, or gave incompletes and allowed credit retrieval later. The effects of these policies are visible in the regional “passing all classes” measure, which is higher regionally and for most districts than in prior years. CCER is interested in gathering more information about these waivers and tracking their impacts to make sure that students receive necessary supports in their postsecondary education. If you are interested in joining this conversation, please provide your information in this form. We would love to hear from students, parents, educators, administrators, and the broader community.
Discipline
Unrelated to the pandemic, we have changed the way we calculate the “Discipline” measure. In previous releases of the dashboard, the measure attributed exclusionary discipline based on the school that a student was at for the majority of the year. This was to prevent students from being counted at multiple schools, leading to numbers that didn’t equal the total number of students in the Road Map Project region. However, if a student had an event of exclusionary discipline at a school that they were at for a smaller portion of the year, it would be inaccurately attributed to their “primary enrollment” school. To fix this, we now measure the percent of all students enrolled at a school who had an exclusionary discipline event. The denominator (number of students ever enrolled) may be larger than listed elsewhere on the dashboard.
Navigating the Dashboard
The dashboard now has a home page with high-level summaries of each of the five pages. You can click one of the available measures to view it directly on the dashboard.
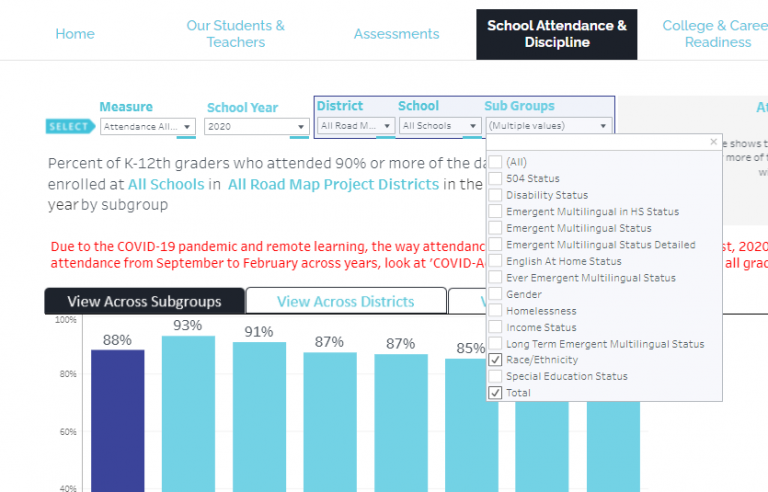
Previously, selecting “View All Subgroups” showed a measure across all available subgroups (race/ethnicity, emergent multilingual status, etc.). Now we have added a “Subgroup Category” filter, which lets you select specific categories to view.
We have added more detailed Emergent Multilingual (EM) status subgroups. In addition to current EM and non-EM, you can now view “Emergent Multilingual Status Detailed” for some measures. Included are “Former EM,” “Never EM,” and “Current EM.” For more recent research on previous and current emergent multilingual students in the region, read the Our Rising Voices report.
Our team is working to make the Data Dashboard easier to use, and would love to hear your suggestions! If you would be interested in participating in a Data Dashboard focus group, or to join in further discussion around the topics we have discussed in this issue, please provide your information in this form. We look forward to continuing these conversations with you!
Posted in: Data and Research , Data for Action